 |
Principal Investigator: Farhad Memarzadeh
Division of Technical Resources
Office of Research Services
National Institutes of Health
Bethesda, Maryland
September 1998 |
 |
National Institutes of Health
Ventilation Design Handbook on Animal Research Facilities Using Static Microisolators
VOLUME I 
Principal Investigator
Farhad Memarzadeh
Division of Technical Resources
Office of Research Services
National Institutes of Health
Bethesda, Maryland
September 1998
Executive Summary
Optimum air quality in laboratory animal facilities is essential for the general health and well-being of researchers, animal caregivers, and the animals, as well as for the integrity of the studies. Since both genetic heritage and the environment influence biological responses, researchers must always be aware of the influence of the environment on the animals' biological responses. With more information about environmental effects, laboratory animal facility design and management can be improved. Researchers will obtain the most reliable and repeatable results from their studies and experiments when laboratory animals have the best possible environmental conditions.
Many thousands of square feet of animal research facilities are designed and constructed each year. Unfortunately, inadequate information is available regarding ventilation rates and patterns that are required to maintain acceptable micro (cage) and macro (room) environments. There is an immediate need for a definitive scientific basis for selecting the ventilation rates and for designing effective ventilation systems for laboratory animal facilities. Engineers need this information to design environments with good air quality and low energy.
Current ventilation guidelines are based largely on anthropomorphic views and not on scientifically defined animal needs. Most research has focused solely on room conditions. Limited research has addressed ventilation rates, room air distribution, relative humidity and temperature, and other factors and interactions that contribute to acceptable and uniform environments for laboratory animals.
Laboratory animal ventilation should balance air quality, animal comfort, and energy efficiency to provide cage environments that optimize animal welfare and research results. Conditions that optimize animal welfare minimize unintended stress factors that can affect research results. Researchers and animal caregivers have the right to expect a healthy and pleasant working environment.
The literature review described in section 1.3 identifies the following important factors in controlling the macro- and microenvironments:
- Ventilation in filter top cages does not necessarily increase with increasing room ventilation air change rates
- The filter top can significantly affect cage ventilation performance
- Improved cage washing procedures and animal room cleanliness may reduce the concentrations of bacteria that produce ammonia
- Bedding type can significantly affect ammonia generation
- Ammonia concentration over 25 ppm promotes the infection in rats' respiratory tracts
- A recent study suggests that groups of five mice display a behavioral and autonomic thermoneutral zone that is surprisingly similar to individual mice. Individual and group-housed mice prefer a temperature of approximately 29 to 30 °C (84 to 86 °F), which is warmer than the standard housing temperature of 22 to 24 °C (72 to 76 °F). This suggests that groups of mice may experience cold stress under standard housing conditions.
A comprehensive study of air movement, heat transfer, and contamination dispersal in the macro- and microenvironment in animal facilities could only be undertaken using computational fluid dynamics (CFD). CFD is an advanced three-dimensional mathematical technique used to compute the motion of air, water, or any other gas or liquid. All conditions must be correctly specified in the CFD simulation in order to obtain accurate results.
All the inputs for the CFD had to be defined for this study, including heat dissipation and surface temperature of the mice; and moisture, CO2, and NH3 generation rates for mice. Defining this data required an extensive series of experimental measurements using sets of outbred female mice (HSD-ICR) with an initial age of four weeks. The mice were placed in microisolator cages with hardwood (beta chip) shaving bedding for a 13-day period. In addition to providing specific data and recommendations this document details experimental and numerical procedures that can be used for other species.
Cage characteristics needed to be fully understood so an accurate mathematical model of a microisolator cage could be built. As most of these data were not available from literature, an unprecedented set of experimental measurements was undertaken. Without this foundation of accurate experimental data the CFD analysis of the rooms would have had limited value.
On the subject of ventilation the most commonly accepted source of performance criteria for research animal facility ventilation systems is the Guide for the Care and Use of Laboratory Animals, Institute of Laboratory Animal Resources (1996) and the American Society of Heating Refrigerating and Air Conditioning Engineers Applications and Fundamentals Handbooks. The Guide makes general recommendations for ventilation of animal facilities and recognizes that investigation of individual designs by techniques such as CFD may be necessary to ensure optimum performance, e.g. "The guideline of 10-15 fresh-air changes per hour has been used for secondary enclosures for many years and is considered an acceptable general standard. Although it is effective in many settings, the guideline does not take into account the range of possible heat loads; the species, size, and number of animals involved; the type of bedding or frequency of cage-changing; the room dimensions; or the efficiency of air distribution from the secondary to the primary enclosure. In some situations, the use of such a broad guideline might pose a problem by overventilating a secondary enclosure that contains few animals and thereby wasting energy or by underventilating a secondary enclosure that contains many animals and thereby allowing heat and odour accumulation."
Ventilation recommendations are often based on room air exchanges. However, cage ventilation rates may be inadequate in some cages and excessive in others depending on cage and facility design. Recommendations for room ventilation rates of 10 to 15 air changes per hour (ACH) are an attempt to provide adequate ventilation for the room and the cages. This recommendation is based on the assumption that adequate ventilation in the macroenvironment provides sufficient ventilation to the microenvironment. This may be a reasonable assumption when cages have a top of wire rods or mesh. However, several studies have shown that covering cages with filter tops provides a protective barrier for rodents and reduces airborne infections and diseases, especially neonatal diarrhea, but can result in significant differences in microenvironmental conditions due to changes in air movement caused by the cage cover.
Exactly how well or how poorly these filter top cages are ventilated in a room was not known until this research was completed. Previously published literature only identifies the relative performance of different types of tops. Although some data exist on the flow resistance of filter material, determining how and how much air gets in and out of the cages was vital for this study. This research has quantitatively measured the ventilation performance of a specific filter top microisolator cage for different airflow conditions. It investigated the airflow between the upper and lower moldings, taking into consideration leakage that occurs due to the fact that the top sits loosely on the bottom, compared with the ventilation through the filter top itself. A wind tunnel was designed and tests were performed to compare the ventilation of single cages to two cages standing next to one another, closely representing a cage sitting on a rack in an animal facility room. CFD models of a cage in the wind tunnel, various orientations of a cage in the wind tunnel, and airflow velocities were constructed and run. These showed an excellent agreement between the simulation results and the measured values, confirming that the cage model used in the room simulations was representative of a microisolator cage.
In order to analyze the ventilation performance of different laboratory animal research facilities, numerical methods based on computational fluid dynamics were used to create computer simulations of more than 100 different room configurations. The performance of this approach was successfully verified by comparison with experimental measurements in a typical laboratory. A total of 12.9 million experimental data values were collected in an empty (except for the ventilation system) laboratory scenario, while 0.66 million data values were collected in a populated (included simulated animal racks) laboratory. The comparison between the numerical and experimental data was particularly good for temperature and gas concentrations. In particular, the average error between the experimental and computational temperature in the laboratory was 14.36 percent, while the equivalent value for gas concentrations was 14.50 percent. The low air velocities proved more difficult to measure, which further demonstrated the need for computational techniques that are not limited by measurement uncertainties encountered at low velocities. To investigate the relationships between room configuration parameters and the room and cage environments within laboratory animal research facilities, the following parameters were varied:
- supply air diffuser type and orientation, and air temperature and moisture content;
- Room ventilation rate;
- Exhaust location and number;
- Room pressurization;
- Rack layout and cage density;
- Change station location, design, and status;
- Leakage between the lower and upper cage moldings; and
- Room width.
The 100 different room configurations were then ranked according to various parameters, namely:
- Room Temperature;
- Cage Temperature;
- Room Relative Humidity;
- Cage Relative Humidity;
- Room CO2;
- Cage CO2;
- Room NH3;
- Cage NH3.
It is therefore possible for the designer, in using this document, to select the most appropriate design configuration based on their particular requirements.
Room pressurization, change station design, and room width were found to have little effect on ventilation performance. However, all the other factors were found to affect either or both of the macro- or microenvironments to a greater or lesser extent.
The key conclusions of this research are:
Ammonia production rates depended on the relative humidity in the cages and the number of days that had elapsed since the bedding was changed. Figure 0.1 shows the data points measured and the best fit lines ("Poly.") for the data. Five days after the last change of bedding ammonia was produced in a high humidity environment at approximately three times the rate as in a low humidity environment. This research showed that the rate of ammonia generation was not directly dependent on temperature, although temperature has a direct effect on the relative humidity of the air.

Figure 0.1 Ammonia generation rate measured over 10 days at high and low humidity
Acceptable room and cage ammonia concentrations after five days without changing cage bedding are produced by room supply airflow rates of about 0.85cfm (0.0004m3/s) per 100g of body weight of mice. This is equivalent to 5 ACH for rooms with single density racks that were considered in this study, and 10 ACH for rooms with double density racks. This indicates that it could be possible to adjust the common practice of changing bedding every four days to changing after five days.
The temperature of the supply air must be set appropriately for the heat load in the room. In this study, the change station produced 720W and the mice around 500W in the single density racks, which required supply discharge temperatures of 11 °C (52 °F) at 5 ACH to provide exhaust temperatures of around 22 °C (72 °F). For double density racks the supply discharge temperature should be 14.8 °C (59 °F) at 10 ACH.
This study used dark period/lights off to give the highest CO2 and NH3 generation rates. If lighting is to be included an allowance should be made for 600W of additional heat from the lights leading to lower supply discharge temperatures.
- Increasing the room ventilation rate for a given design appears to have a beneficial effect on the room's breathing zone ventilation as measured by CO2 and ammonia concentrations (see figure 0.2). For the single density racks parallel to the walls increasing the supply flow rate from 5 ACH to 20 ACH reduced the breathing zone CO2 concentration from 140 ppm to 63 ppm. This is a decrease of 55 percent. For the double density racks perpendicular to the walls the reduction is even more dramatic. A reduction of over 70 percent, from over 300 ppm to 93 ppm, occurred when the flow rate was increased from 5 ACH to 20 ACH.
However the high values of CO2 concentration of about 300 ppm above the background levels are still significantly too low. American Conference of Governmental Industrial Hygienists (ACGIH) recommends a threshold limit value (TLV), time weighted average (TWA) of 5,000 ppm (9,000 mg/m3) for carbon dioxide. ACGIH also recommended a Short Term Exposure Limit (STEL) of 30,000 ppm (54,000 mg/m3).

Figure 0.2 Room Breathing Zone CO2 concentrations (ppm) for single density racks with the Thoren change station and double density racks with both Thoren and Laboratory Products change stations
Although 20 ACH appears to produce the best ventilation for the low induction diffuser with low level exhaust cases compared with over 50 percent of the 15 ACH runs, other diffusers, exhaust locations or rack layouts actually have even lower room CO2 concentrations.
Higher supply discharge airflow rates are usually accompanied by higher supply discharge temperatures since the air does not have to be so cold to extract the heat generated in the room. This allows animal facility designers/operators to choose between using low supply volumes at lower supply temperatures, with a lower cost for fans but higher cost for air conditioning, or high flow rates at higher temperatures, which result in higher fan but lower air conditioning costs. Which of these options will provide the best economic return depends on the facility's circumstances.
- Increasing the room ventilation rate does not have a significant effect on cage ventilation (see figure 0.3). Increasing the supply flow rate from 5 ACH to 20 ACH for single density racks parallel to the walls reduces the CO2 concentration from 1764 ppm to 1667 ppm, a reduction of only 6 percent. For the double density racks perpendicular to the walls the reduction is slightly more significant: about 2300 ppm to 1800 ppm, or roughly 20 percent.
Since air exchange rates in excess of 10 ACH do not materially improve environmental conditions within the cages, more care should be given to proper cage arrangement and air distribution.

Figure 0.3 Cage CO2 concentrations (ppm) for single density racks with the Thoren change station and double density racks with both Thoren and Laboratory Products change stations.
- Ammonia concentrations in both cages and rooms can be reduced by increasing the supply air temperatures. This reduces the relative humidity (RH), for a constant moisture content in the air. In addition, the lower RH leads to lower ammonia generation. Raising the supply discharge temperature from 18.8 °C (66 °F) to 22 °C (72 °F) at 15 ACH raises the room temperature by 3 °C (5 °F) to about 23 °C (73 °F), and the cages by 2.7 °C (4 °F) to around 24.8 °C (77 °F). This can reduce ammonia concentrations by up to 50 percent.
Using 22 °C (72 °F) as the supply discharge temperature at 5 ACH, which is the lowest flow rate considered, for double density racks produces a room temperature of about 26 °C (79 °F) with cage temperatures only slightly higher. Although this higher temperature provides a more comfortable environment for the mice (Gordon, Becker, and Ali, 1997) the high room temperature may be uncomfortable for the scientists and animal caregivers working in the room.
Ceiling or high-level exhausts tend to produce lower room temperatures when compared to low-level exhausts. All CFD models were designed to have 22 °C (72 °F) for a given supply air temperature at the room exhausts. There were also a small number of tests run with high supply temperatures. These studies indicate that low-level exhausts are less efficient at cooling the room and will be more expensive to operate.
Low-level exhausts appear to ventilate the cages slightly better than ceiling or high-level exhausts when the cages are placed parallel to the walls. Improvement was up to 27 percent for the radial diffuser, 4 percent for the slot diffuser, and 25 percent for the low induction diffuser. See figure 0.4. The ammonia concentration in the cages (see figure 0.5) appears to be even further reduced although this is due to the higher temperatures in the low-level exhaust cases when compared to the ceiling and high-level exhausts which act to reduce the relative humidity and the ammonia generation rate.
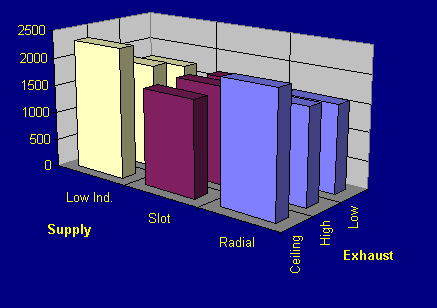
Figure 0.4 Mean CO2 concentration (ppm) in cages for Radial, Slot and Low Induction supply diffusers with Ceiling, High-Level and Low-Level Exhausts.
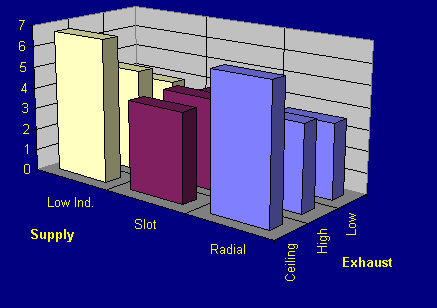
Figure 0.5 Day 4 mean ammonia concentration (ppm) in cages for Radial, Slot and Low Induction supply diffusers with Ceiling, High-Level and Low-Level Exhausts
The room concentrations of CO2 and ammonia do not show any supply or exhaust type to be significantly better or worse than any other type (see figures 0.6 and 0.7). Of the many supply diffuser and exhaust locations considered in this work, it is not possible to select one configuration which will always perform better than another. Designers and operators of animal facilities will need to consider carefully which parameters are important to them and select a layout which balances all their requirements for animals and the humans that work with them.
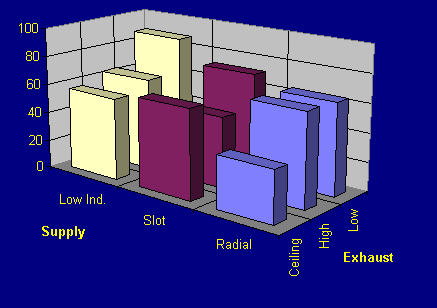
Figure 0.6 Mean CO2 concentration (ppm) in room breathing zone for Radial, Slot and Low Induction supply diffusers with Ceiling, High-Level and Low-Level Exhausts
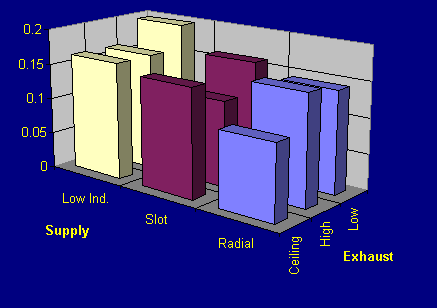
Figure 0.7 Mean Day 4 ammonia concentration (ppm) in room breathing zone for Radial, Slot and Low Induction supply diffusers with Ceiling, High-Level and Low-Level Exhausts